Data display
In 1977, John Tukey, one of the prominent statisticians and mathematicians in history, published a book entitled Exploratory Data Analysis. In it, he laid out general principles on how researchers should handle their first encounters with their data, before formal statistical inference. Most of us spend a lot of time doing exploratory data analysis, or EDA, without really knowing it. Mostly, EDA involves a graphical exploration of a data set.
We start off with a few wise words from John Tukey himself, chosen from that brilliant book.
- “Exploratory data analysis can never be the whole story, but nothing else can serve as a foundation stone—as the first step.”
- “In exploratory data analysis there can be no substitute for flexibility; for adapting what is calculated—and what we hope plotted—both to the needs of the situation and the clues that the data have already provided.”
- “There is no excuse for failing to plot and look.”
- “There is often no substitute for the detective’s microscope—or for the enlarging graphs.”
- “Graphs force us to note the unexpected; nothing could be more important.”
- “‘Exploratory data analysis’ is an attitude, a state of flexibility, a willingness to look for those things that we believe are not there, as well as those we believe to be there.”
Clearly data display, or plotting, is central to exploratory data analysis.
The Python visualization landscape
Let us start by looking at some of the many plotting packages available in Python. In a talk at PyCon in 2017, Jake VanderPlas, who is one of the authors of one of them (Altair), gave an overview of the Python visualization landscape. That landscape is depicted below, taken from this visualization of it by Nicolas Rougier. (It is from 2017, so it is dated, and definitely not complete, notably missing Panel and domain-specific plotting like napari and Folium, for example.)
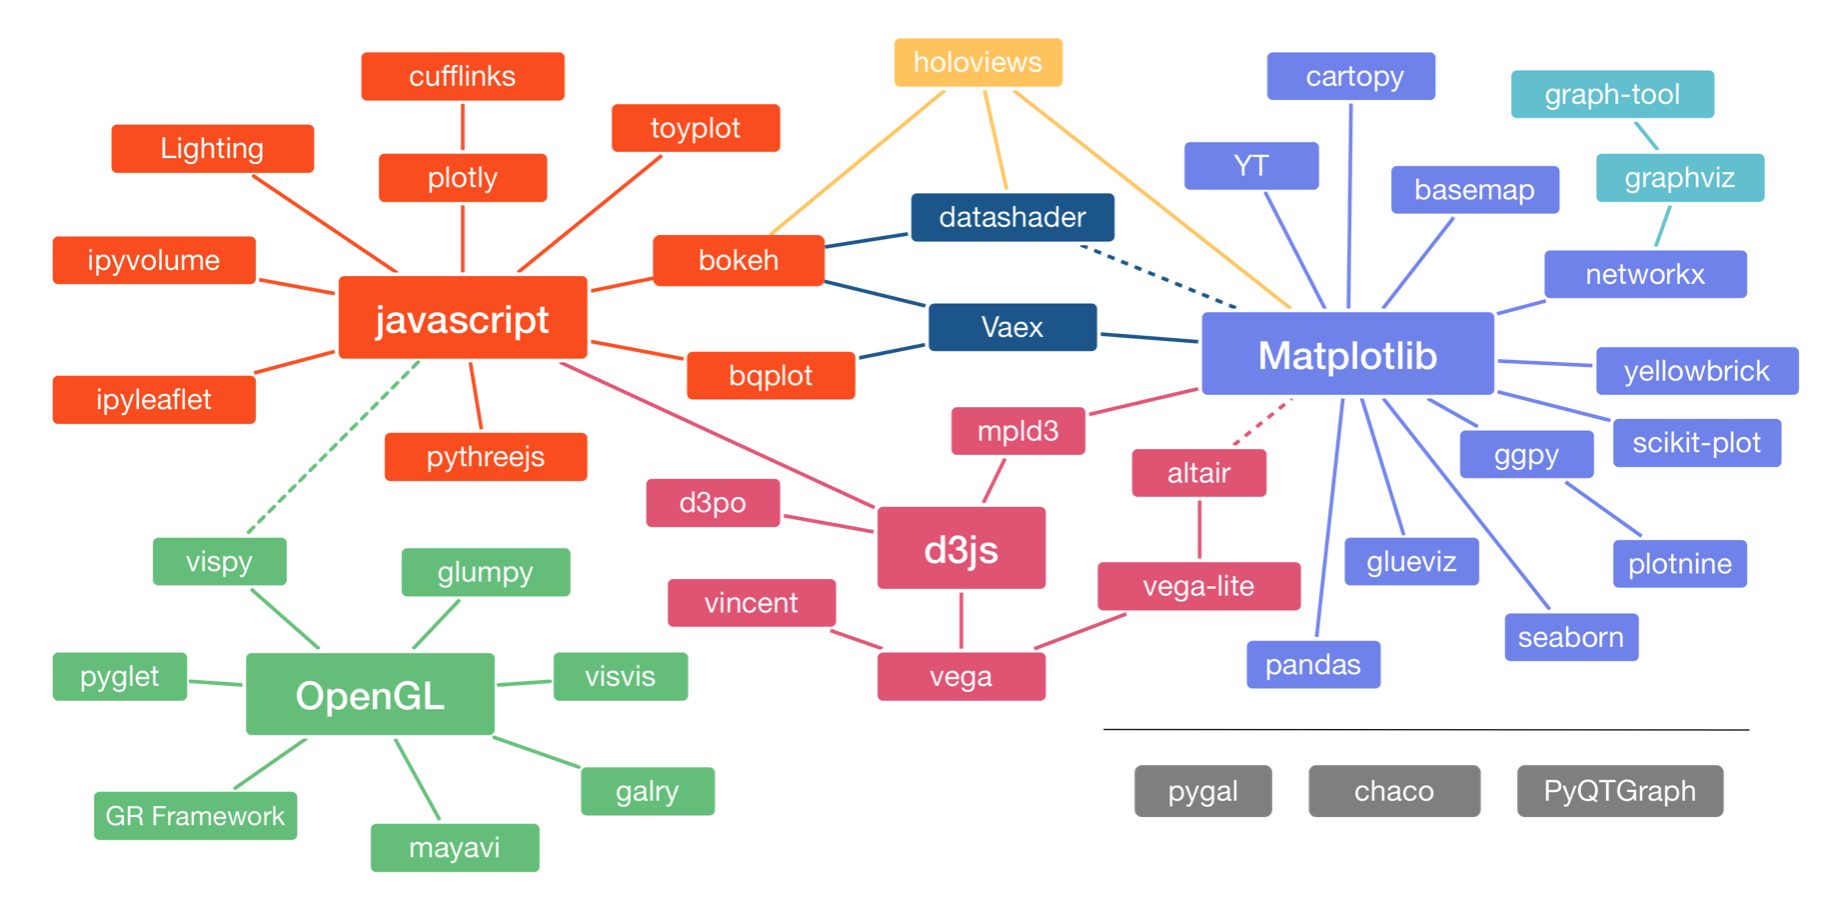
The landscape is divided into three main pods based on the low-level renderer of the graphics, JavaScript, Matplotlib, and OpenGL (though Matplotlib is higher-level than JavaScript and OpenGL). We will not discuss packages based on OpenGL. Packages that use JavaScript for rendering are particularly well suited for interactivity in browsers. Interactivity and portability (accomplished by rendering in browsers) are key features of modern plotting libraries, so we will use JavaScript-based plotting in the workshop (as I do in my own work).
Though we will be using Bokeh (and a little bit of HoloViews/Datashader), for a neuroscientist working in Python, it is important to take note of the following.
- Matplotlib is by far the most widely used plotting package in Python. It was even developed a neuroscientist! Seaborn is also widely used as a higher level statistical plotting package that has Matplotlib as its backend (and also developed by a neuroscientist!). We choose to use Bokeh because it is effective
- There are many neuroscience-specific packages that have plotting modules, like MNE, Nilearn, and SpikeInterface. Here, we are focusing on general tools. If you have master of lower-level plotting software, you can get much more out of domain-specific packages. You are also unshackled to do the visualization you want to do, and not just those that are available.